Computational Prediction of Allosteric Structural Changes by a Simple
Mechanical Model: Application to Hemoglobin T
пр
R Transition
Chunyan Xu and
Ivet Bahar
Biochemistry, 2002, submitted
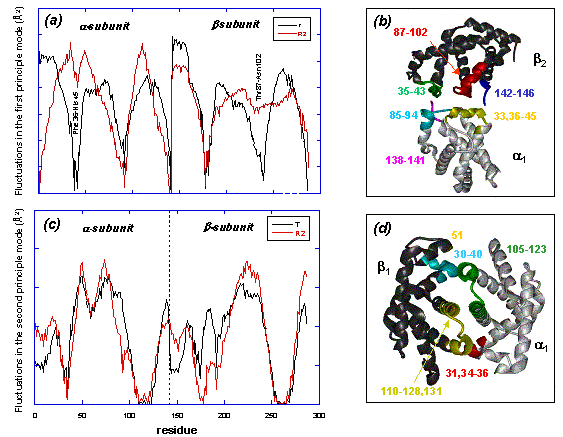
Distribution of ms fluctuations driven by the global mode and the
second slowest mode of motion

(a).Distribution
of ms fluctuations driven by the global mode of motion. Maxima refer
to flexible regions, and the minima to hinge sites. Note that compared
with T, two minima at
a36-45
and
b87-102
disappear in the R form,
suggesting a loosening or relaxation, and thereby an impediment in the
mechanical function of the hinge sites. The dynamics of
a-
and
b-subunits
are very similar in the T form, while the dynamics are different in
the R2 form.
(b).The
hinge regions of the slowest mode correspond to the
a1b2
interface.
(c).Second
slowest mode shape.
(d).Hinge
sites operative in the second slowest mode correspond to hinge sites
at the
a1-b1
and a2-b2
interfaces.
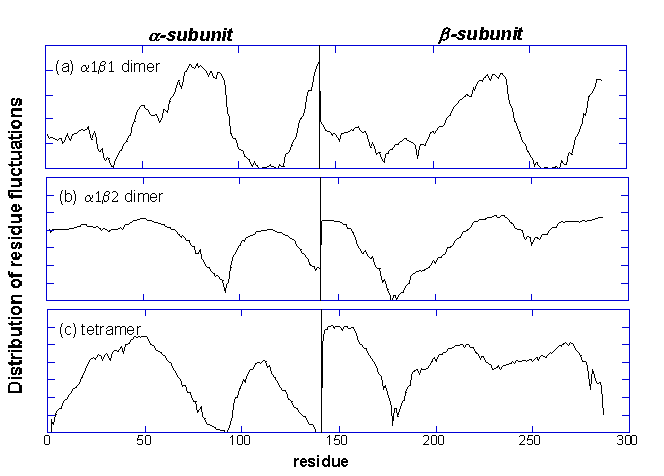
Comparison of the first
principle mode of R2 tetramer (part c) to that of
a1b1
(part
a) and
a1b2
(part
b)
dimers.

The coordinates for the R2 tetramer, the
a1b1
dimer or a1b2
dimer of R2 are used to calculate the mean-square fluctuation driven
by the slowest mode. We can see that in the
a1b1
dimer, the a-subunit dynamics
is similar to the b-subunit
dynamics while in the a1b2
dimer, the a-subunit dynamics
is very different from the b-subunit
dynamics, and the profiles a1b2
dimer and R tetramer are very similar, indicating that the global mode
shape of the tetramer is predominantly controlled by that of the
a1b2
(or a2b1) dimer.
Back to Hemoglobin Main Page
|